We already know the best performance/cost GPUs for state-of-the-art deep learning and computer vision are RTX GPUs. So, which RTX GPU should you use? To help you decide, I benchmark the three premier GPUs: 2080 ti non-blower, 2080 ti blower, and RTX TITAN. These benchmarks include variation and coverage of
- multiple batch sizes, datasets, architectures, and GPUs.
- different kinds of measurements to understand the effects of thermal throttling.
- the physical hardware set-up that yielded these benchmarks.
If you’ve seen Justin Johnson’s computer vision benchmarks on the older GTX 1080 GPUs, you can view this work as an RTX 2080 GPU extension + additional batch sizes and datasets. Divide Justin’s tables by 16 to compare with these because he reports millisecond-per-minibatch instead of millisecond-per-image.
Link to GitHub: [https://github.com/cgnorthcutt/cnn-gpu-benchmarks]
To reproduce: All benchmarks were computed using PyTorch 2.0 on an Ubuntu 18.04 LTS, Intel 10-core i9 CPU machine with 128 GB memory running CUDA 10.1 with exact workstation specifications [here]. The code to reproduce these results is available: [here for ImageNet], [here for CIFAR-100], and [here for CIFAR-10].
What benchmarks?
This post benchmarks:
- architectures: ResNet-152, ResNet-101, ResNet-50, and ResNet-18
- GPUs: EVGA (non-blower) RTX 2080 ti, GIGABYTE (blower) RTX 2080 ti, and NVIDIA TITAN RTX
- Datasets: ImageNet, CIFAR-100, and CIFAR-10.
Key Takeaways are summarized at the end [here].
Three timing measurements are used to account for thermal throttling
Each measurement separates ideal performance from actual performance by accounting for thermal throttling in isolation and thermal throttling due to surrounding GPU heat dissipation and GPU positioning.
The three benchmark measurements are:
- SECOND-BATCH-TIME: Time to finish second training batch. This measures performance before the GPU has heated up, effectively no thermal throttling.
- AVERAGE-BATCH-TIME: Average batch time after 1 epoch in ImageNet or 15 epochs in CIFAR. This measures takes into account thermal throttling.
- SIMULTANEOUS-AVERAGE-BATCH-TIME: Average batch time after 1 epoch in ImageNet or 15 epochs in CIFAR with all GPUs running simultaneously. Instead of multi-GPU training, each GPU is given its own independent training task. This measures the effect of thermal throttling in the system due to the combined heat given off by all GPUs.
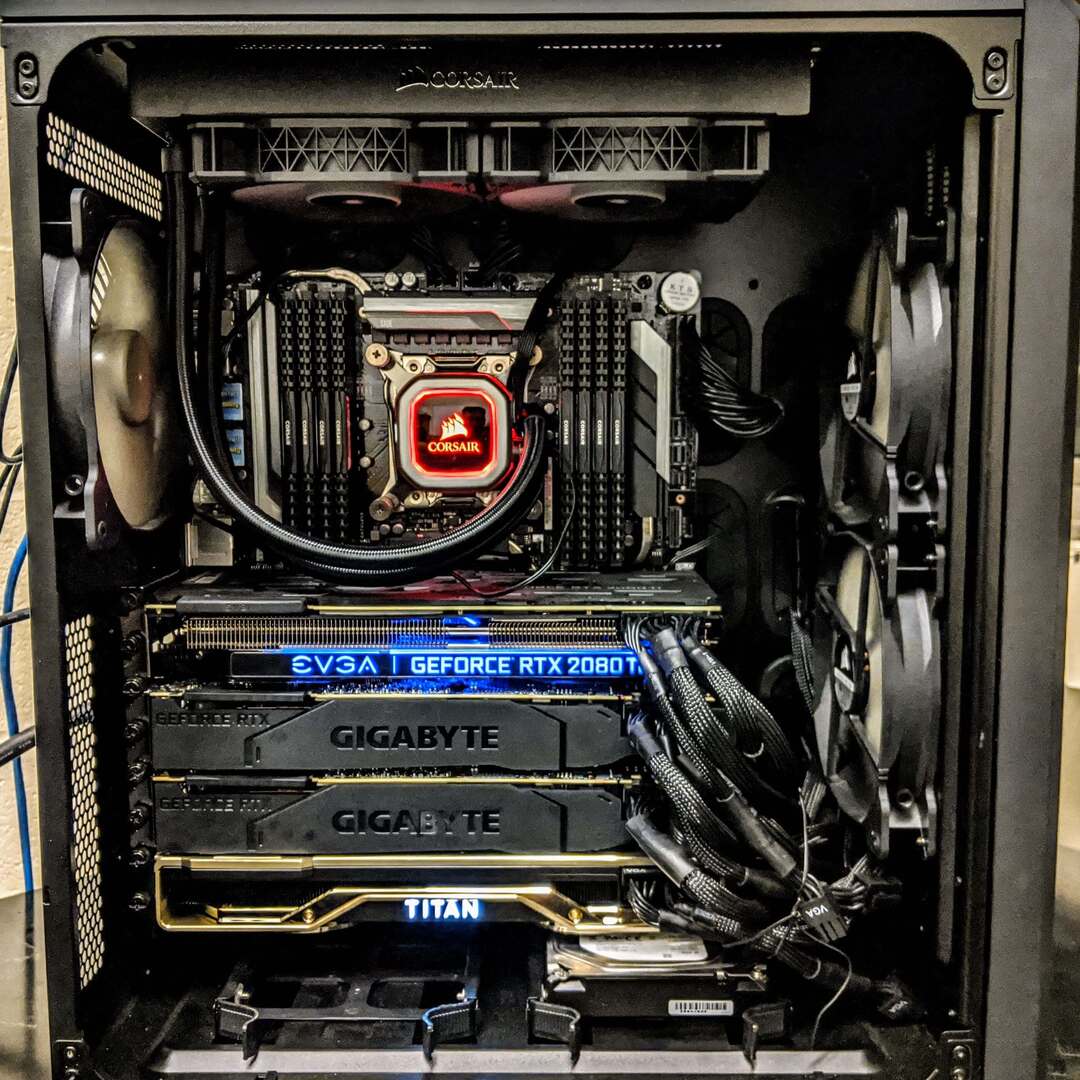
The machine used for all benchmarks
The machine used for all benchmarks is described in detail [here], with the exception of the GPUs. You can view the exact machine used below.
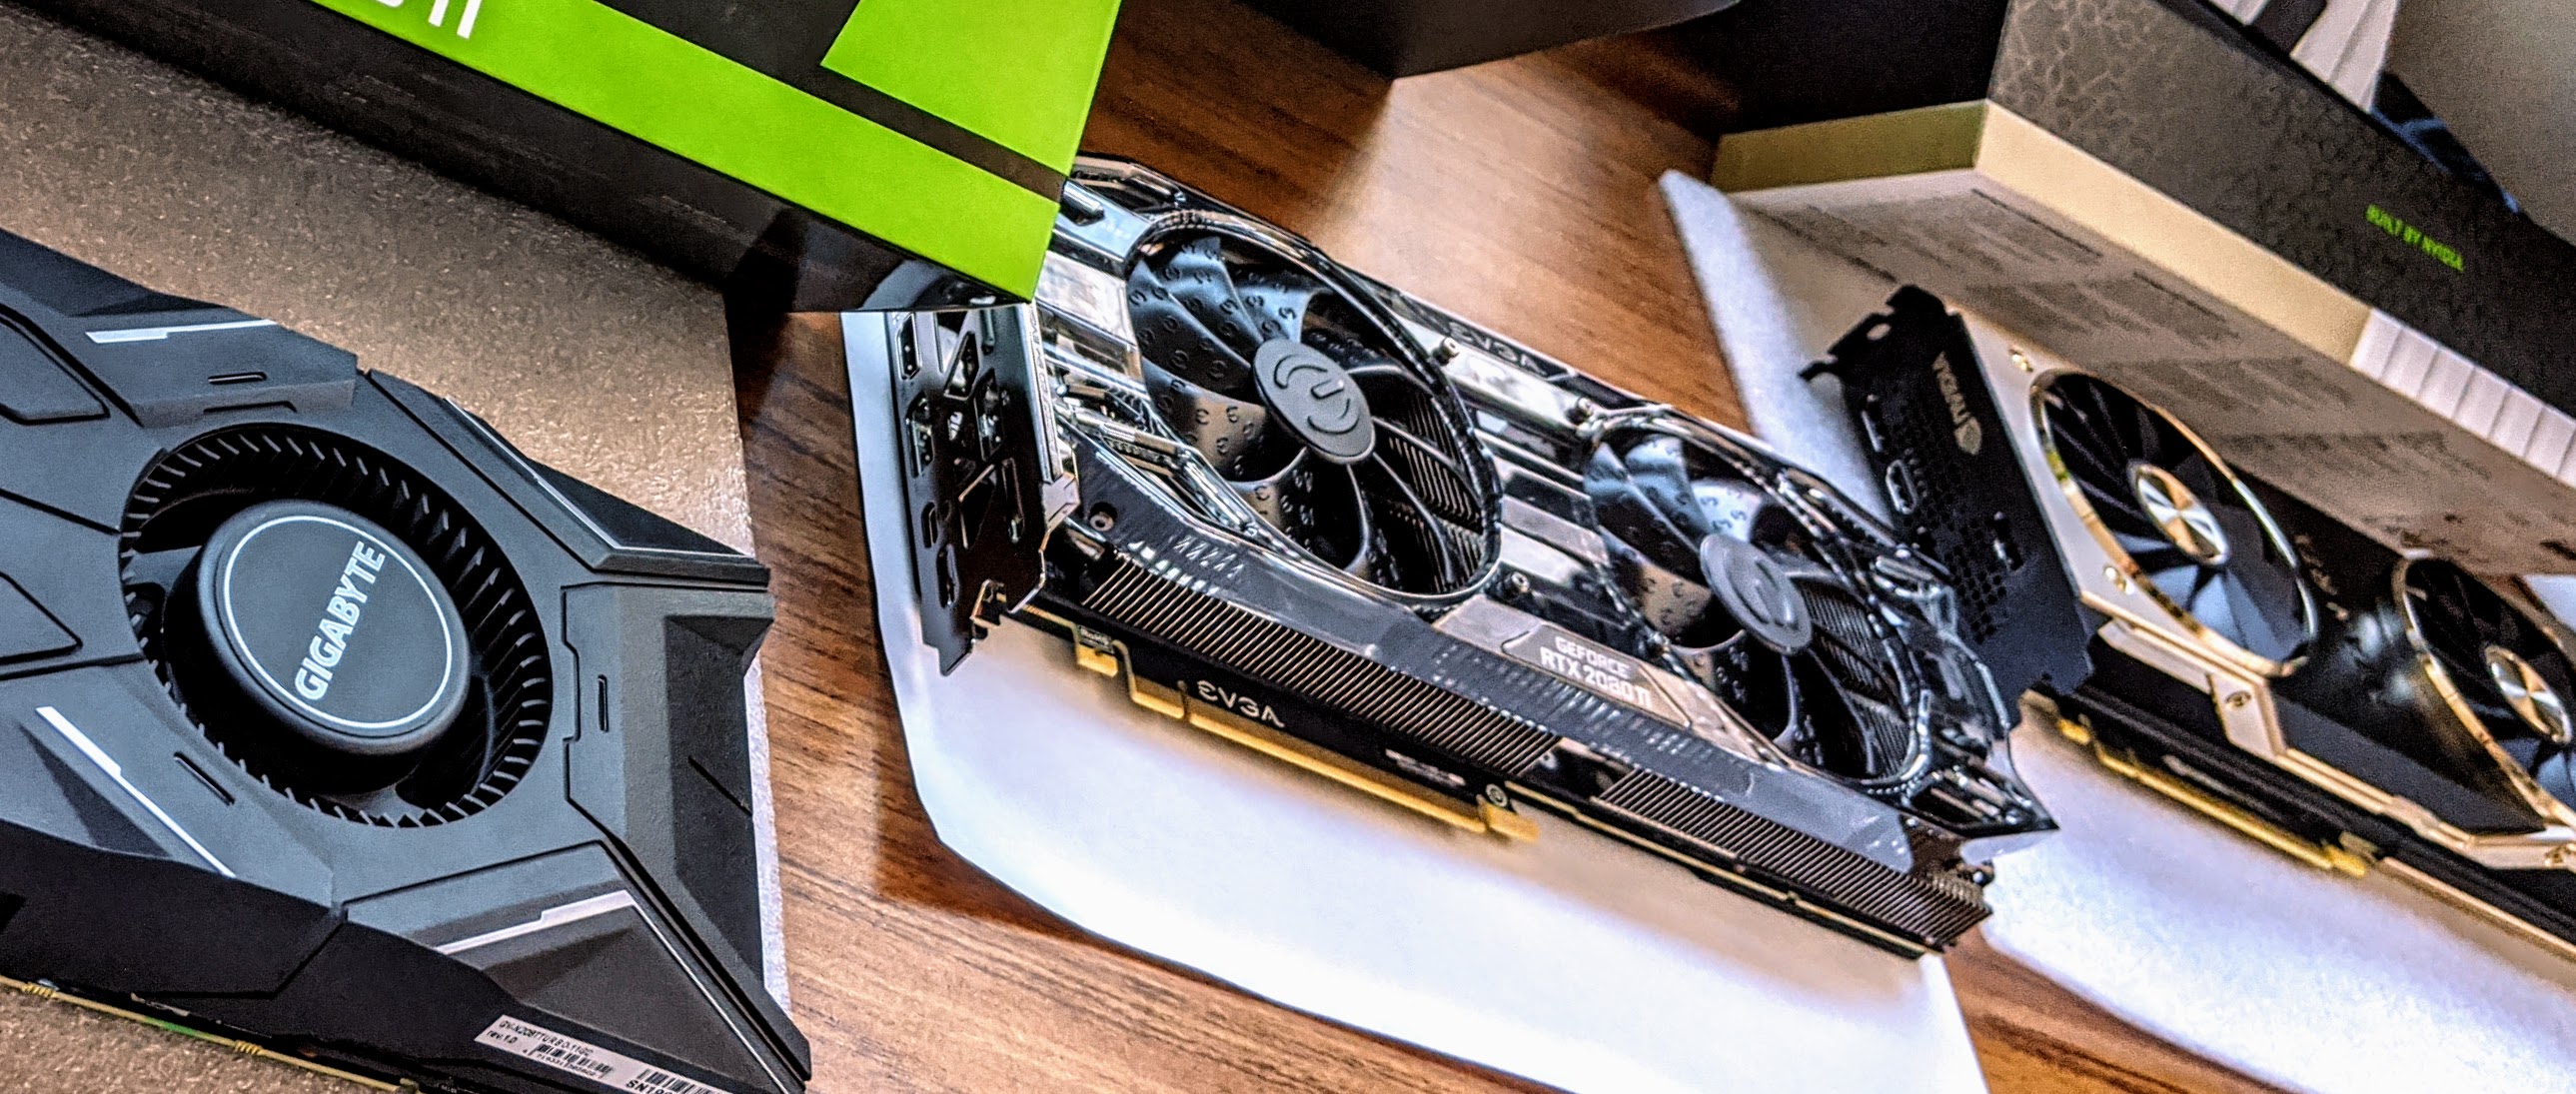
GPU Contestants
These RTX GPUs are compared:
- EVGA (non-blower-style, Black Edition) RTX 2080 ti (~$1160)
- GIGABYTE (blower-style) RTX 2080 ti (~$1120)
- NVIDIA TITAN RTX (~$2500)
The Tesla V100, P100, and T4 GPUs are omitted because the performance increase of these GPUs scales poorly with the price increase and the L7 blog focuses on democratizing affordable state-of-the-art learning.
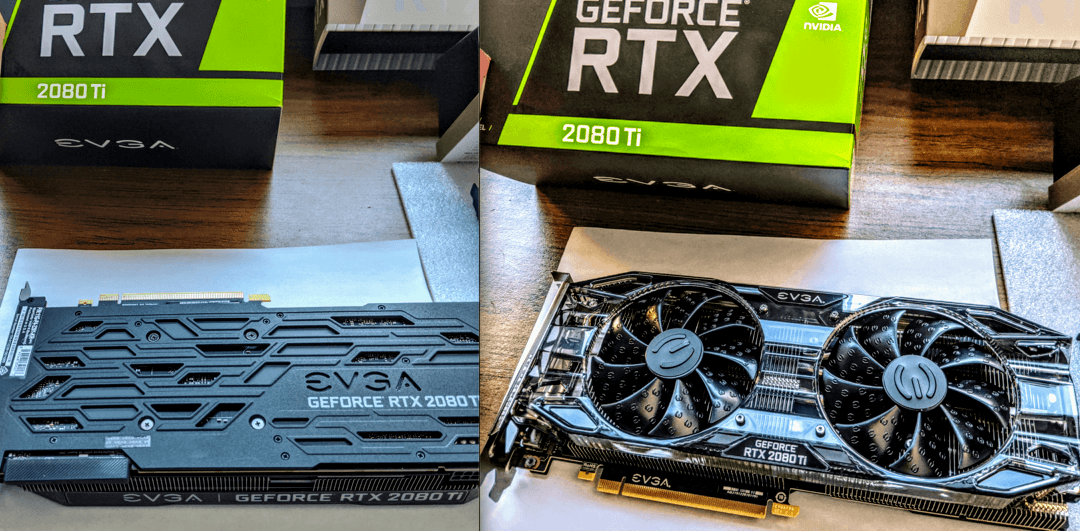 Bottom-side view (LEFT) and top-side view (RIGHT) of the EVGA (non-blower-style, Black Edition) RTX 2080 ti GPU used in these benchmarks.
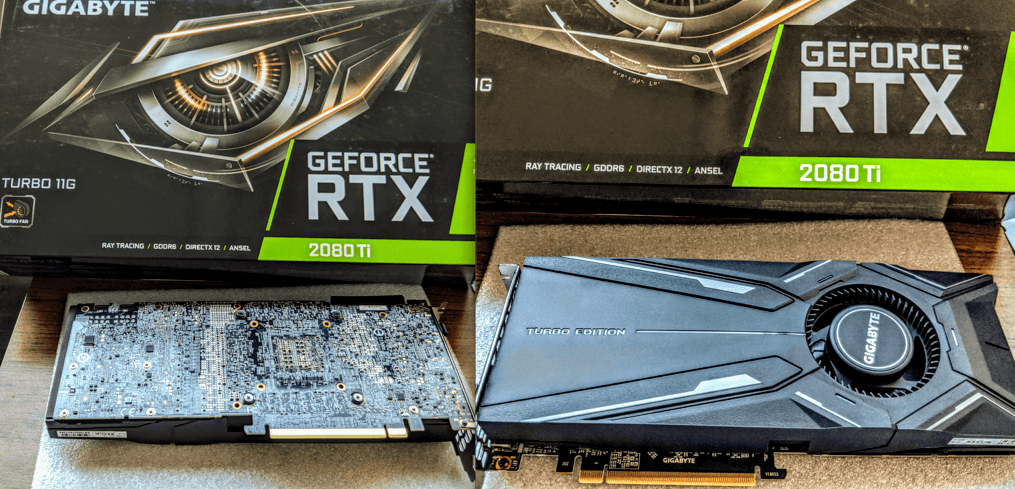 Bottom-side view (LEFT) and top-side view (RIGHT) of the GIGABYTE (blower-style) RTX 2080 ti GPUs used in these benchmarks.
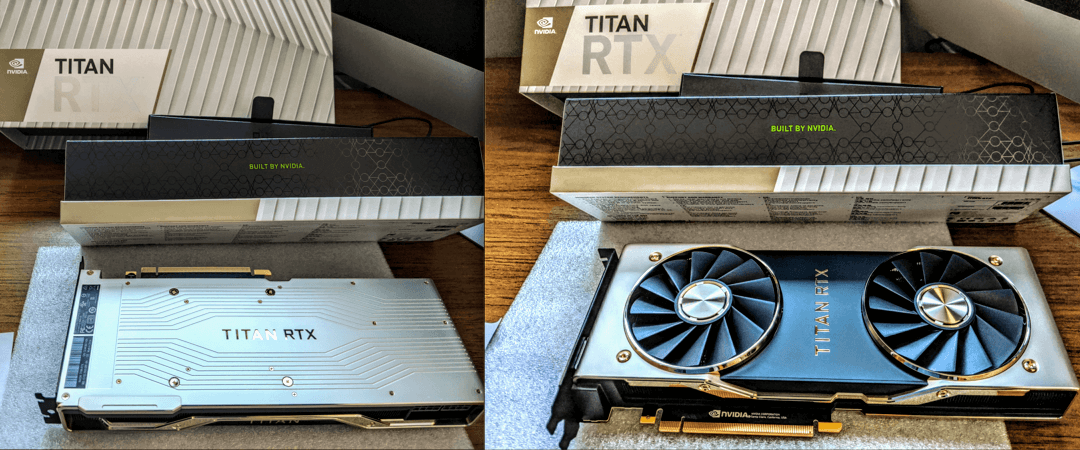 Bottom-side view (LEFT) and top-side view (RIGHT) of the TITAN RTX GPU used in these benchmarks.
The Benchmarks
Tables report values in milliseconds/image, where smaller implies better performance.
ImageNet
For ImageNet, these batch sizes are evaluated:
- ResNet-152 with batch size = 32
- ResNet-101 with batch size = 64
- ResNet-50 with batch size = 64
- ResNet-18 with batch size = 128
Each table reports time in milliseconds/image, computed by taking the average time per batch / batch size. Results are reproducible via [this ImageNet script]. To reproduce the results in this table, run something like this in your terminal:
python3 imagenet_train_crossval.py \
	--gpu {INTEGER OF GPU} \
	--arch resnet50 \
	--batch-size 64 \
	/location/of/imagenet/dataset/
where --gpu specifies the 0-based integer of the GPU you want to train with, --arch specifies the model architecture, and /location/of/imagenet/dataset/ should be replaced with dataset location.
SECOND-BATCH-TIME (ImageNet) [milliseconds/image]
This measurement evaluates the speed of each GPU in isolation on the second training batch, before thermal throttling can occur. In terms of performance, Titan RTX > EVGA non-blower > GIGABYTE blower, with speeds increasing with smaller architectures.
| GPU | ResNet152 | ResNet101 | ResNet50 | ResNet18 |
|---|---|---|---|---|
| GIGABYTE (blower) RTX 2080 ti | 8.69 | 6.06 | 3.73 | 1.12 |
| EVGA (non-blower) RTX 2080 ti | 8.56 | 5.78 | 3.61 | 1.09 |
| NVIDIA TITAN RTX | 7.91 | 5.55 | 3.52 | 1.02 |
NVIDIA TITAN RTX is around 10% faster in nearly all cases.
AVERAGE-BATCH-TIME (ImageNet)
This measurement evaluates the speed of each GPU in isolation after one epoch on ImageNet – this gives the GPU plenty of time to heat up and takes into account thermal throttling due only to the GPU and airflow. Observe the decrease in performance compared to the table above due to thermal throttling.
| GPU | ResNet152 | ResNet101 | ResNet50 | ResNet18 |
|---|---|---|---|---|
| GIGABYTE (blower) RTX 2080 ti | 8.97 | 5.92 | 3.86 | 1.31 |
| EVGA (non-blower) RTX 2080 ti | 8.78 | 5.92 | 3.78 | 1.34 |
| NVIDIA TITAN RTX | 8.34 | 5.64 | 3.56 | 1.28 |
SIMULTANEOUS-AVERAGE-BATCH-TIME (ImageNet)
This measurement includes an additional column to designate the position of the GPU in the machine. All 4 GPUs run simultaneously on the same training task independently, with two blower-style GPUs in the middle, the TITAN RTX on the bottom for increased airflow, and the non-blower GPU on the top. The position of the GPUs affects the benchmarks due to thermal throttling. I’ve reported the best positioning to reduce thermal throttling. You can read about this and the thermal impact of different positioning of GPUs [here].
| GPU | Position | ResNet152 | ResNet101 | ResNet50 | ResNet18 |
|---|---|---|---|---|---|
| EVGA (non-blower) RTX 2080 ti | top | 9.66 | 6.58 | 4.02 | 2.06 |
| GIGABYTE (blower) RTX 2080 ti | mid-top | 9.22 | 6.25 | 3.84 | 2.06 |
| GIGABYTE (blower) RTX 2080 ti | mid-bottom | 10.78 | 7.42 | 4.44 | 2.02 |
| NVIDIA TITAN RTX | bottom | 8.22 | 5.55 | 3.47 | 1.99 |
Observe an overall decrease in performance compared to the two tables above due to thermal throttling caused by heat dissipation from all GPUs running simultaneously. However, RTX NVIDIA TITAN improves the SIMULTANEOUS-AVERAGE-BATCH-TIME by 30% when compared to the mid-bottom 2080 ti.
How does Batch Size effect Training Speed on ImageNet?
The table below reports the SECOND-BATCH-TIME and AVERAGE-BATCH-TIME benchmarks for the NVIDIA TITAN RTX, run in isolation.
| Architecture | ResNet152 | ResNet152 | ResNet101 | ResNet50 | ResNet50 |
|---|---|---|---|---|---|
| Batch size | 128 | 64 | 128 | 256 | 128 |
| SECOND-BATCH-TIME | 7.51 | 7.83 | 5.38 | 3.33 | 3.38 |
| AVERAGE-BATCH-TIME | 7.66 | 7.95 | 5.44 | 3.41 | 3.42 |
Observe a slight (at most 4%) decrease in performance on smaller batch sizes for both SECOND-BATCH-TIME and AVERAGE-BATCH-TIME benchmarks.
CIFAR-100
For CIFAR-100 and CIFAR-10, the following are benchmarked:
- ResNet-152 with batch size = 256
- ResNet-50 with batch size = 256
Smaller batch sizes and/or model architectures are not benchmarked because GPU utilization is too low on CIFAR for significant differences in GPU performance.
Each table reports time in milliseconds/image, computed by taking the average time per batch / batch size. Results are reproducible via [this CIFAR-100 script]. To reproduce these results, run something like this in your terminal:
python3 cifar100_train_crossval.py \
	--gpu {INTEGER OF GPU} \
	--arch resnet50 \
	--batch-size 256 \
	/location/of/cifar100/dataset/
SECOND-BATCH-TIME (CIFAR-100)
| GPU | RESNET-152 | RESNET-101 | RESNET-50 | RESNET-18 |
|---|---|---|---|---|
| GIGABYTE (blower) RTX 2080 ti | 0.102 | 0.072 | 0.047 | 0.020 |
| EVGA (non-blower) RTX 2080 ti | 0.102 | 0.072 | 0.046 | 0.020 |
| NVIDIA TITAN RTX | 0.094 | 0.066 | 0.044 | 0.020 |
AVERAGE-BATCH-TIME (CIFAR-100)
For CIFAR, AVERAGE-BATCH-TIME is computed after the 15th epoch to compare with a similar number of total images trained as ImageNet.
| GPU | RESNET-152 | RESNET-101 | RESNET-50 | RESNET-18 |
|---|---|---|---|---|
| GIGABYTE (blower) RTX 2080 ti | 0.104 | 0.075 | 0.047 | 0.020 |
| EVGA (non-blower) RTX 2080 ti | 0.103 | 0.072 | 0.047 | 0.020 |
| NVIDIA TITAN RTX | 0.097 | 0.070 | 0.044 | 0.017 |
The NVIDIA TITAN RTX trains 7% faster for ResNet-152. Overall, performance is similar across GPU and architecture.
SIMULTANEOUS-AVERAGE-BATCH-TIME (CIFAR-100)
| GPU | Position | ResNet152 | ResNet101 | ResNet50 | ResNet18 |
|---|---|---|---|---|---|
| EVGA (non-blower) RTX 2080 ti | top | 0.117 | 0.111 | 0.125 | 0.095 |
| GIGABYTE (blower) RTX 2080 ti | mid-top | 0.082 | 0.080 | 0.088 | 0.072 |
| GIGABYTE (blower) RTX 2080 ti | mid-bottom | 0.052 | 0.047 | 0.055 | 0.044 |
| NVIDIA TITAN RTX | bottom | 0.027 | 0.027 | 0.027 | 0.027 |
Interestingly, while all GPUs perform similarly in isolation on CIFAR, the NVIDIA TITAN RTX trains 2x-4x faster when all GPUs are running simultaneously. Even with heat dissipation from all four GPUs, the NVIDIA TITAN RTX when placed at the bottom (so that its fans are not blocked by other GPUs) processes a CIFAR image with ResNet-152 every 27 microseconds.
CIFAR-10
Each table reports time in milliseconds/image, computed by taking the average time per batch / batch size. Results are reproducible via [this CIFAR-10 script]. To reproduce these results, run something like this in your terminal:
python3 cifar10_train_crossval.py \
	--gpu {INTEGER OF GPU} \
	--arch resnet50 \
	--batch-size 256 \
	/location/of/cifar10/dataset/
SECOND-BATCH-TIME (CIFAR-10)
| GPU | RESNET-152 | RESNET-101 | RESNET-50 | RESNET-18 |
|---|---|---|---|---|
| GIGABYTE (blower) RTX 2080 ti | 0.097 | 0.072 | 0.047 | 0.020 |
| EVGA (non-blower) RTX 2080 ti | 0.096 | 0.072 | 0.043 | 0.020 |
| NVIDIA TITAN RTX | 0.091 | 0.065 | 0.040 | 0.021 |
AVERAGE-BATCH-TIME (CIFAR-10)
Like CIFAR-100, AVERAGE-BATCH-TIME is computed after the 15th epoch.
| GPU | RESNET-152 | RESNET-101 | RESNET-50 | RESNET-18 |
|---|---|---|---|---|
| GIGABYTE (blower) RTX 2080 ti | 0.103 | 0.074 | 0.047 | 0.020 |
| EVGA (non-blower) RTX 2080 ti | 0.102 | 0.073 | 0.045 | 0.020 |
| NVIDIA TITAN RTX | 0.095 | 0.069 | 0.044 | 0.022 |
SIMULTANEOUS-AVERAGE-BATCH-TIME (CIFAR-10)
| GPU | Position | ResNet152 | ResNet101 | ResNet50 | ResNet18 |
|---|---|---|---|---|---|
| EVGA (non-blower) RTX 2080 ti | top | 0.112 | 0.110 | 0.122 | 0.102 |
| GIGABYTE (blower) RTX 2080 ti | mid-top | 0.082 | 0.080 | 0.090 | 0.073 |
| GIGABYTE (blower) RTX 2080 ti | mid-bottom | 0.047 | 0.051 | 0.058 | 0.043 |
| NVIDIA TITAN RTX | bottom | 0.026 | 0.026 | 0.026 | 0.027 |
Like CIFAR-100, all GPUs perform similarly in isolation on CIFAR-10, but the NVIDIA TITAN RTX trains 2x-4x faster when all GPUs are running simultaneously.
Key Takeaways
Should you use TITAN RTX?
- On ImageNet, the NVIDIA TITAN RTX trains around 10% faster across all benchmarks.
- On CIFAR, all GPUs perform similarly in isolation, but the NVIDIA TITAN RTX trains 2x-4x faster when all GPUs are running simultaneously.
- To train large-memory ConvNets like VGG19 on large images of size 224x224, the TITAN RTX is required to fit everything in GPU memory. TITAN RTX has 24 GB memory whereas 2080 ti has only 11 GB.
How does Thermal throttling affect GPU performance?
- Across all model architectures, GPUs, batch sizes, and datasets, SECOND-BATCH-TIME (GPU just started running and is cool) is faster than AVERAGE-BATCH-TIME (GPU has been running a while and is hot) and AVERAGE-BATCH-TIME is faster than SIMULTANEOUS-AVERAGE-BATCH-TIME (multiple GPUs have been running a while next to each other and everything is very hot).
- Decrease in performance is more significant from AVERAGE-BATCH-TIME to SIMULTANEOUS-AVERAGE-BATCH-TIME benchmarks.
- With heat dissipation from all four GPUs (SIMULTANEOUS-AVERAGE-BATCH-TIME), the NVIDIA TITAN RTX processed a CIFAR image every 27 microseconds.
- These results depends on the case and cooling in the deep learning GPU rig and GPU positioning.
- To reduce thermal throttling, if you have space, you can use an open-air GPU case.
How does batch-size affect training time?
- Decreasing the batch-size from 128 to 64 using ResNet-152 on ImageNet with a TITAN RTX gpu, increased training time by around 3.7%.
- Decreasing the batch-size from 256 to 128 using ResNet-50 on ImageNet with a TITAN RTX gpu, did not affect training time.
- The difference is likely due to CPU bottlenecking and architecture size.
Related Work
- Relative positioning of GPUs for optimal speed: [view this post]
- How to build a multi-GPU deep learning machine: [view this post]
- Build Lambda’s state-of-the-art 4-GPU rig for $4000 less: [view this post]
Acknowledgements
The GPUs and machines used for these benchmarks were purchased using a grant from the The MIT-IBM Watson AI Lab, MIT Quanta Lab, and the MIT Quest for Intelligence.
Comments